OnePlot Software
Simple yet Powerful Windows Plotting Software
What is OnePlot?
OnePlot is a simple but powerful Windows plotting software designed to make data visualization effortless. Whether you're working on research, presentations, or data analysis, OnePlot streamlines your workflow with an intuitive interface and powerful features.
See OnePlot in Action

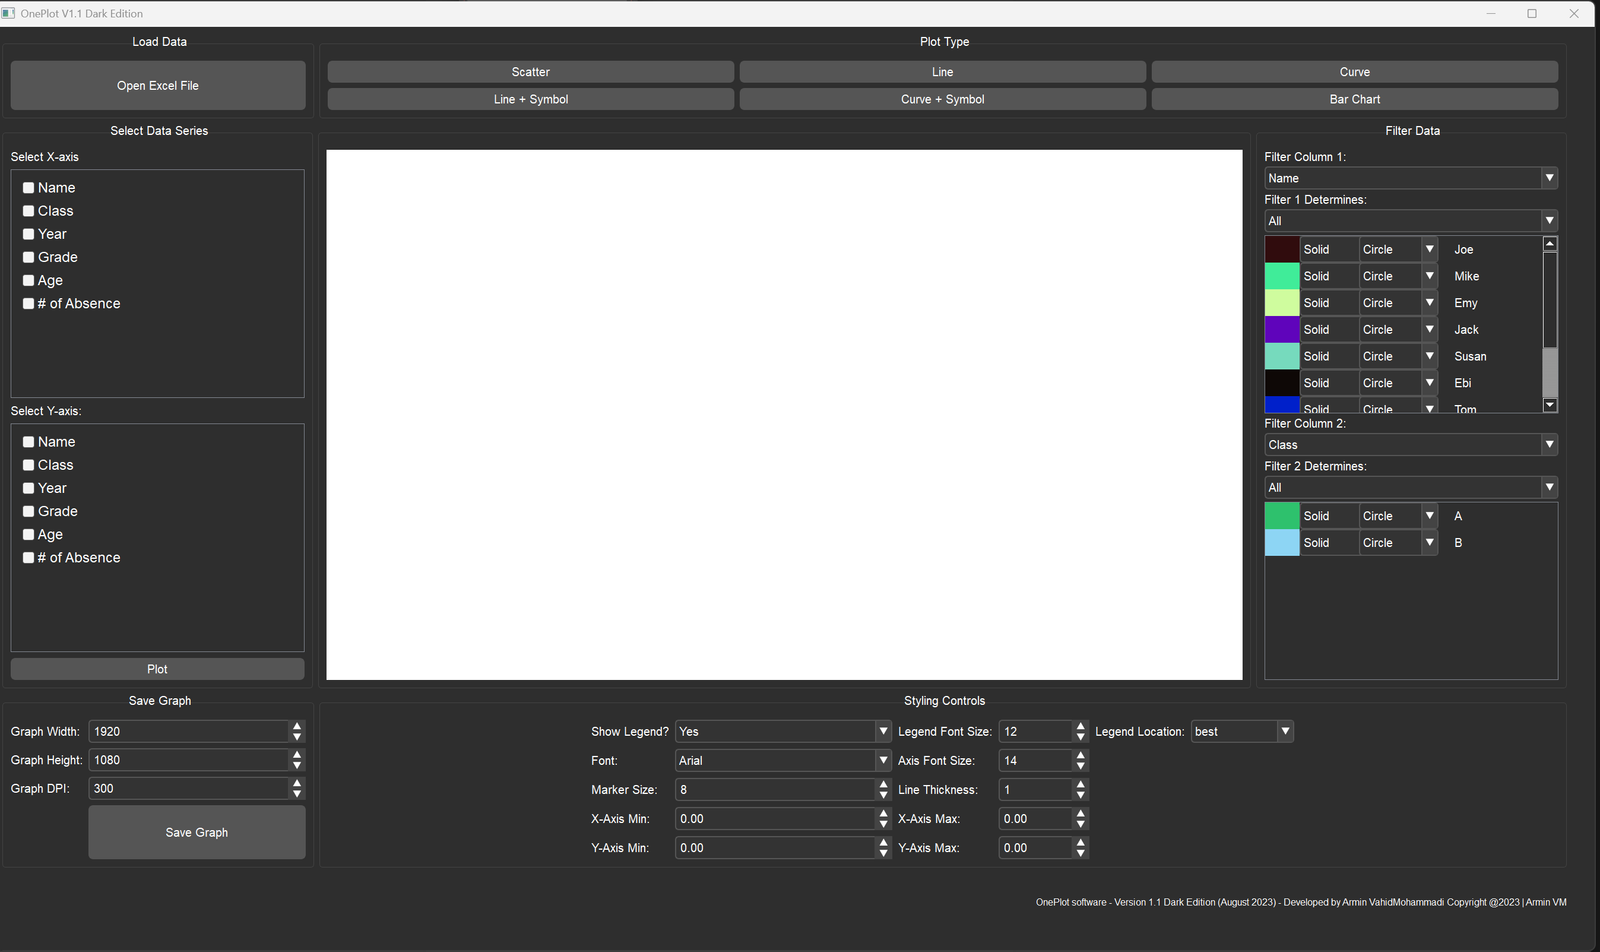
OnePlot's clean and intuitive main interface

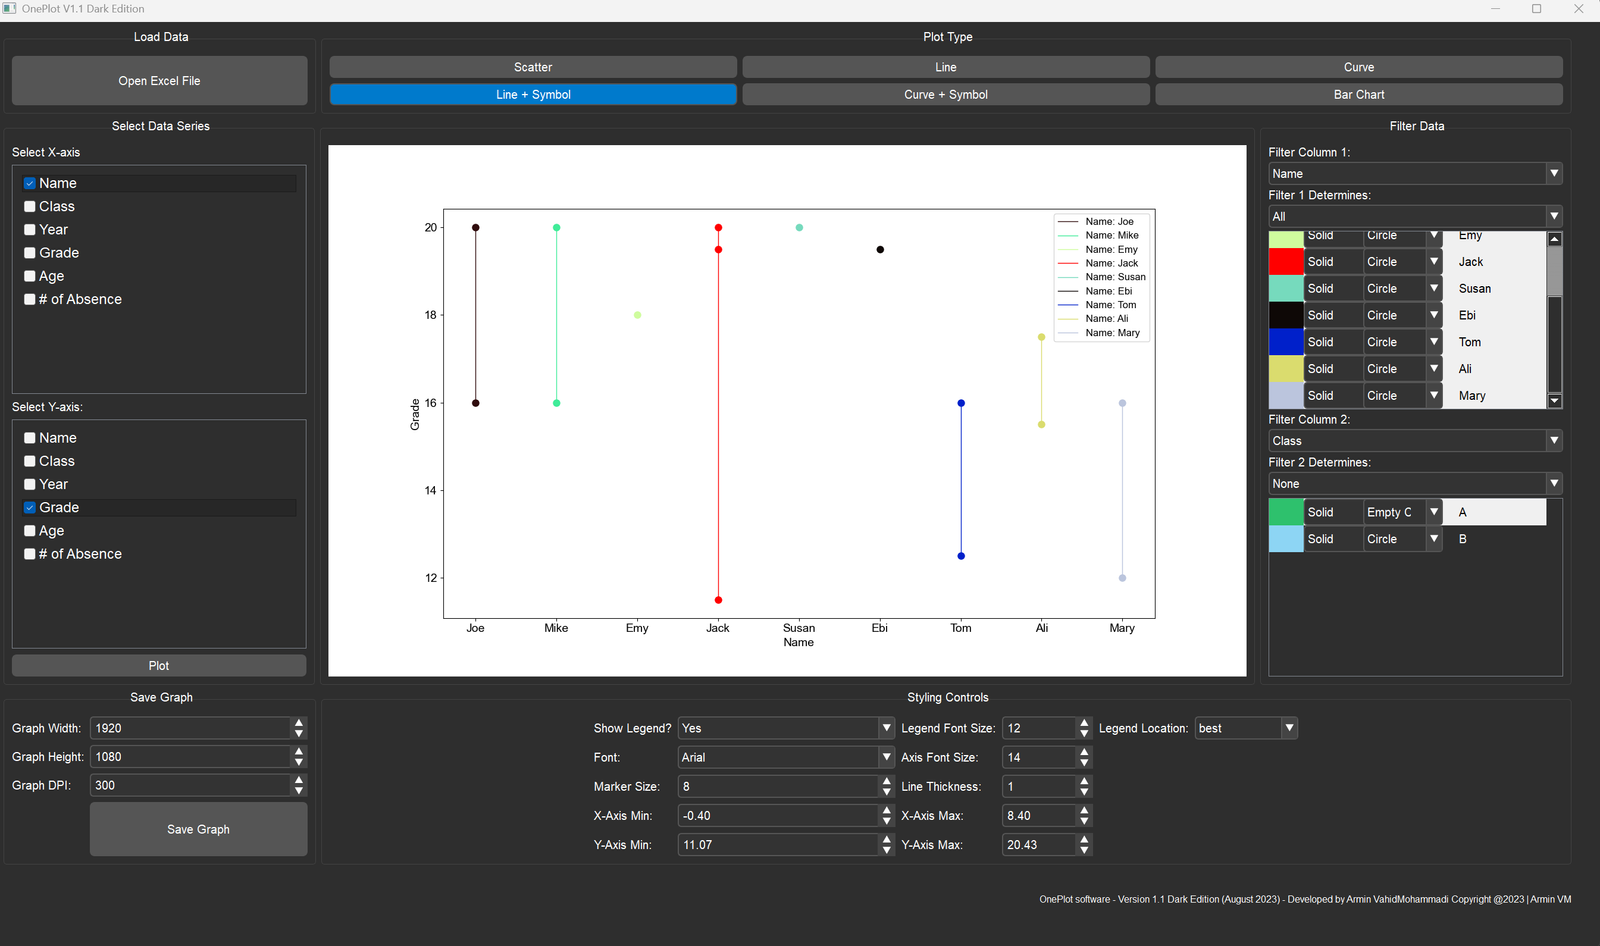
Multiple plot type options

Advanced styling options
Powerful Features
Excel Integration
Seamlessly import data from Excel files with automatic column header detection.
Multiple Plot Types
Create line charts, bar graphs, scatter plots, and more with just a few clicks.
Smart Filtering
Organize and filter your data with intelligent grouping and color-coding options.
Custom Styling
Control fonts, colors, line styles, symbols, and more to match your needs.
High-Quality Export
Export your plots as high-resolution JPG or PNG files with custom dimensions and DPI.
Fast & Intuitive
Simple UI that makes complex plotting tasks easy and straightforward.
How to Use OnePlot
Prepare Your Data
Organize your Excel file with clear column headers. Each column represents a data series. OnePlot reads headers automatically to populate your plotting options.
Download Sample DataLoad & Select
Import your Excel file into OnePlot. Choose your desired plot type and select data series for X and Y axes. The intuitive interface makes this quick and easy.
Filter & Style
Use the powerful filtering options to organize your data into groups. Apply custom colors, line styles, and symbols. The smart logic automatically handles style assignments based on your filter selections.
Customize & Export
Fine-tune font styles, sizes, data ranges, line thickness, and symbol sizes. Set your export dimensions and DPI, then save your professional-quality plot as JPG or PNG.
Ready to Get Started?
Download OnePlot V1.1 for free and start creating beautiful plots today!
Note: I developed OnePlot as a side project in my free time. You're welcome to use it, but please acknowledge and reference it if you use it for presentations or publications. Your feedback and questions are always welcome!